7. Frequently Asked Questions
7.1: General Questions
-
What is JOpera?
JOpera is an autonomic process support system targeted for generic service composition.
-
What do I need to run JOpera?
JOpera runs on Eclipse 3.3/3.4 with Java JDK 1.5) and requires the GEF plugin.
-
What is new in JOpera for Eclipse?
A lot! See 1.2: What's new in JOpera for Eclipse? for more information on all the new features that have been added during the port.
-
Where can I download the source code of JOpera?
Currently the source code of JOpera is not yet available to the general public. If you would be interested in contributing to the project, or you have any other specific reasons for needing the source code of JOpera, please let us know.
-
Can I install/update JOpera from the command line?
Yes!, See 2.1.1: Installation from the Command Line for more information on how to install JOpera from the Eclipse command line.
7.2: Questions about Developing Processes
-
What is a process template?
A process template describes how the tasks, its components, are connected together. It contains a control flow graph, which specifies the partial order to follow when starting the tasks as well as the data flow graph, which defines how tasks exchange data. A process templates is stored in an OML file.
-
What is an instance?
A process instance represents a running process template and contains the state of one execution, including all data that is produced and consumed by the tasks. Multiple instances of the same template can be active at the same time. You can use the Instance Navigator view in of the JOpera Monitor perspective to check what are the instances currently managed by the JOpera Kernel.
-
What is a task?
A task is a basic process component. It can either be an activity or a subprocess.
-
What is an activity?
An activity represents the invocation of an external program (or service) through a variety of protocols.
-
What is a program?
A program is any software component or external system which can be accessed by JOpera using one of the following protocols:
- UNIX pipes (stdin/stdout) - for standard UNIX applications
- SOAP messages - for Web services
- Java local method invocations - for Java classes and Java snippets
- SSH - for remote UNIX command-line applications
- JDBC - to send SQL queries to a database directly from a process
- RESTful interactions on top of HTTP
-
What is a subprocess?
A subprocess is a task which represents a call to another process.
-
What is the
JAVA.SNIPPETcomponent type?This is how you can embed snippets of Java into a process. Any Java code that fits into a method will do..
-
What happened to the
JAVASCRIPTcomponent type?As this was a big source of confusion, we renamed it to
JAVA.SNIPPETin JOpera for Eclipse. -
How much work does it take to test a Web service with JOpera?
After importing its WSDL, just 2 mouse clicks:

Figure 7.1: Quickly write a client process to call a Web service operation- Select the operation and click on
Test - A Test client process will be generated automatically, click on
Startto run it and call the Web service operation
- Select the operation and click on
-
How do I make a task start after another has finished?
Go to the ControlFlow View of the process which contains the tasks and connect the tasks with an arrow.
Now, the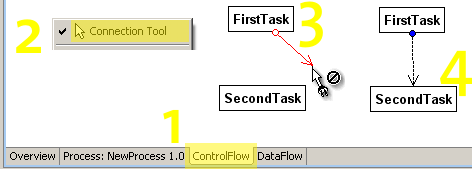
Figure 7.2: Add a control flow dependencySecondtask to which the arrow points to will be started after theFirsttask from which the arrow begins has finished. . -
How do I draw an arrow?
No need for dragging. Instead, follow these steps:
- Make sure you have selected the Connection Tool in the toolbar
- Click on the box you would like the arrow to start from. The box should now be selected
- Click on the other box, the one you would like to connect with the previous one. The arrow should be now there.
-
How do I run two tasks in parallel?
Make sure there is no control flow arrow between them.
-
How do I create an exception handler?
Connect the task handling the exception to the task causing it with a Control Flow arrow. Select the arrow and change its
Dependencyin the Properties View fromFinishedtoFailed.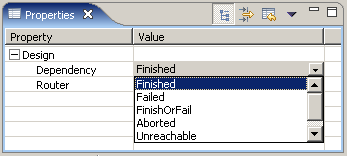
Figure 7.4: A Control Flow Arrow represents different kinds of dependencies -
How do I run multiple copies of the same task over each element of an array?
Use the parallel split data flow connector, look at the
foreachexamples and at this video http://www.jopera.org/docs/videos/foreach for more information.
7.3: Questions about Running Processes
-
How do I start a process?
In general, processes are started with Eclipse launchers in the
Run...menu by selecting theJOpera Processlaunch configuration type. However, a process can also be quickly started from the overview page of the editor, by clicking on theStartbutton.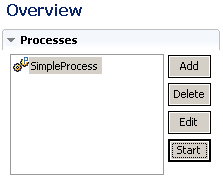
Figure 7.5: The quickest way to start a process is to click on the Start button -
How do I set the input parameters of a process?
This information is entered as part of the launch configuration in the Arguments tab. Thus, different configurations can be stored for the same process.
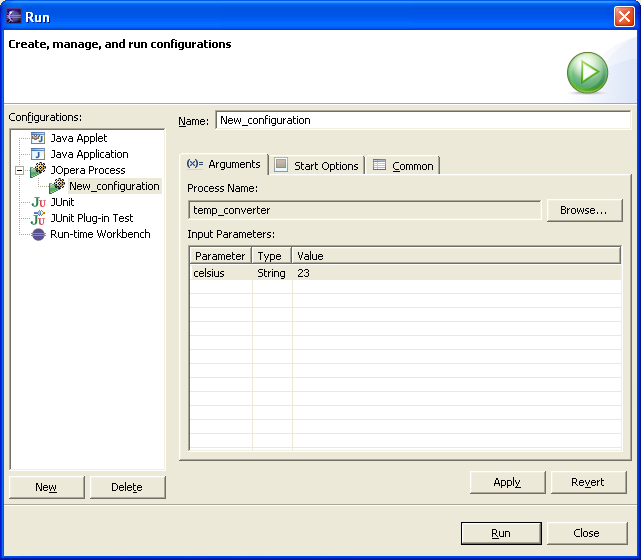
Figure 7.6: Configure a new launch configuration for a JOpera Process -
How do I modify a compiled process?
It depends if you want to keep the old version. If so, you will need to rename the process and compile it with a new name. Otherwise just save the modified changes and the new version of the process should be deployed over the previous one..
-
How do I check whether a process has finished? How do I see the results?
Go to the
JOpera Monitorperspective, select the process instance in theInstance Navigatorview and you should see its current state in the visual editor. Select the task boxes to see more information about them in thePropertiesview.. -
My process has finished, can I save it?
All information about a process is preserved in the kernel's dataspace as long as the user doesn't delete it. If you have configured the kernel to use persistent storage, this information may even survive kernel crashes. Starting in JOpera 2.3.2, the
freezecommand, will save the state of the processes in a file. -
Can I see the execution time of a process?
Yes, make sure you are showing the advanced properties of the process (Figure 7.7).
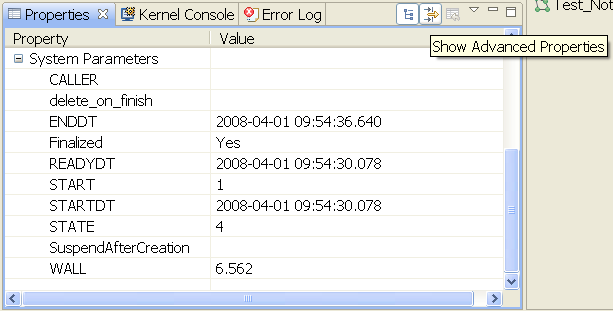
Figure 7.7: Logged execution times shown in the advanced properties view
7.4: Questions about Integrating Processes with other applications
-
Would it be possible to write a script in Perl or other scripting language to start a JOpera process?
Yes, this can be done through the Web service interface. Processes are automatically published as Web services and the WSDL for each process is listed on http://localhost:8080/wsdl With this, you can write a client to start a process using any of the above languages. If you are allergic to SOAP, you can also try the new REST API.
-
What if I want to call a process from a Java application?
It depends, you can also go through the previous solution if you want to keep a certain degree of separation between your Java client application and the JOpera process. Otherwise, especially if you are writing your Java application as an Eclipse plugin, tighter forms of integration are possible.
7.5: Running JOpera as a server
-
Can I deploy my JOpera workflows to run on a server?
Yes.
-
Do I need to buy some complex/expensive/large J2EE application server to run my JOpera processes on a server?
No.
-
So, what do I need to setup to run a JOpera server?
You need Linux, Java, Eclipse and the
JOpera Serverfeature. After unpacking some Eclipse distribution, to install the JOpera server run the following command./eclipse -application org.eclipse.equinox.p2.director -repository http://www.update.jopera.org/,http://download.eclipse.org/releases/helios -installIU org.jopera.server -nosplash
This will install the JOpera Server feature. -
How do I start the JOpera server from the command line?
You just need to run a special "headless" Eclipse application called
ch.ethz.jopera.kernel.KernelApplicationand pre-configure the workspace where the OML files are pre-deployed. For example:./eclipse -application ch.ethz.jopera.kernel.KernelApplication -data /home/jopera/workspace/ -nosplash
will start the JOpera server using the workspace in/home/jopera/workspace. This can be a workspace in which you have previously created at least one JOpera project using the normal JOpera for Eclipse IDE. The project should contain the.omlfiles with the processes and programs you want to run from the server. -
What happens if the workspace of the JOpera server is empty??
Since version 2.5.0, JOpera will initialize it with a new project called
jopera. You have to manually copy your.omlfiles into thisjoperaproject folder if you want to deploy your processes on the server. -
How do I control a local JOpera server?
You can access JOpera from the command line, just like you would using the
Kernel Consoleview in the Eclipse user interface. Refer to the Section: 10.4: JOpera Kernel Command Line Reference for more information on the available commands. -
Can I connect to a JOpera server with the Monitoring perspective?
Yes, but only if the server runs on the same machine as the client. Remote monitoring is currently disabled by default, mainly for security reasons. Contact
client@jopera.orgif you are interested in remotely monitoring your JOpera server. You can also use the Monitoring Widget (5.2: Adding a Monitoring Widget). -
Can I dynamically deploy workflows on the server without restarting it?
Yes, please contact
deploy@jopera.orgif you are interested in running a JOpera server in production. -
Can I access a JOpera server remotely?
Of course, through its Web service interface. JOpera comes with three different interfaces:
- Each published process can be started by invoking it as a Web service (their WSDLs are automatically generated and listed under: http://localhost:8080/wsdl
- The SOAP engine API is accessible from: http://localhost:8080/api/APIService?wsdl
- The REST engine API is accessible from: http://localhost:8080/rest
Note: These URLs are also available from the JOpera for Eclipse IDE if you install the Web Services feature.
-
I use 8080 to run Tomcat. How do I run the JOpera API on a different port?
Look into the JOpera Preferences page called
Engine Threads.
which also allows you to disable the HTTP server if you do not need it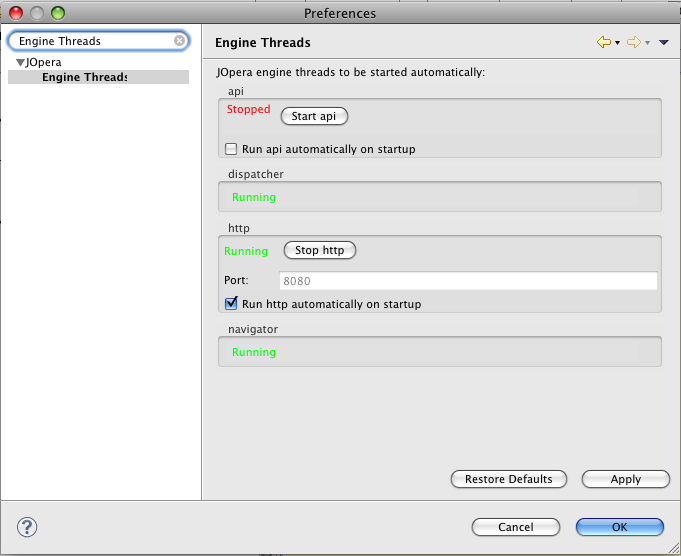
Figure 7.8: Control the port of the embedded JOpera server from this preferences pageNote: This Preference page is only available from the JOpera for Eclipse IDE, but you can use it also to pre-configure a workspace that will be deployed on the server.
7.6: RESTful JOpera API
-
How do I remotely start a process deployed on the JOpera server from the command line?
Try the following:
curl -d "Action=start" http://localhost:8080/rest/dag/DAG/1.0/
This will start asynchronously to execute the version1.0of the process calledDAGwhich is found inside thedag.omlfile stored in the root of any JOpera project of the server's workspace. The process will be started using the default values for its input parameters. The server will return a URL identifying the newly created process in theLocationHTTP header.curl -d "Action=run" http://localhost:8080/rest/dag/DAG/1.0/ -d "time=1234"
This will run synchronously to execute the same workflow, using1234as the value of itstimeinput parameter. The server will wait until the workflow has completed its execution before responding to the client. So if you useAction=runthe client will be blocked for as long as the process is running. The response in this case will contain the final state of the process and its output. -
How do I download the results of my workflow from the command line?
Try the following:
curl http://localhost:8080/rest/dag/DAG/1.0/42 -H "Accept:application/json"
This will download the entire state of the execution of the instance number 42 of the version1.0of the processDAGof thedag.omlfile stored in the root of any JOpera project of your server workspace. The state will be formatted using the JSON notation (try it to see how it looks like: http://localhost:8080/rest/dag/DAG/1.0/0/?_Accept=application/json ) This is a snapshot of the current state, so you do not need to wait for the workflow to finish before you can get its partial results . -
How do I download the results of my workflow from the command line in XML format?
Change the value of the Accept header to
application/xmlas in the following examplecurl http://localhost:8080/rest/dag/DAG/1.0/42 -H "Accept:application/xml"
This will retrieve a snapshot of the instance number 42 of the version1.0of the processDAGof thedag.omlfile stored in the root of any JOpera project of your server workspace. The XML has the following structure:<jopera> <process name="{dag}DAG[1.0]"> <instance name="0"> <task name="0"> <box name="Input"> <param name="time">1000</param> </box> </task> </instance> </process> </jopera>Where theparam,box,task,instanceelements are repeated as needed. -
How do I get a snapshot of all instances of a given process in HTML format?
Use:
curl http://localhost:8080/rest/dag/DAG/1.0/-1 -H "Accept:text/html"
Simply put -1 for the instance identifier. Since version 2.4.9 you can also use the*wildcard.curl "http://localhost:8080/rest/dag/DAG/1.0/*" -H "Accept:text/html"
-
There is too much data, can I ask the JOpera RESTful API to only give me the state of a certain task?
Yes, just append the name of the task in the URL, as follows:
http://localhost:8080/rest/dag/DAG/1.0/42/A/
This will give you the state of task calledAof instance number 42. -
What if I only want the state of the process, but leaving out the one of its internal tasks?
Use the following URL:
http://localhost:8080/rest/dag/DAG/1.0/42/0/
This will give you the state of workflow instance 42 but without its tasks, so only the workflow input/output (and system) parameters will be returned. Basically if you use0for the task name, you can address the process. -
What if I only want to get the input of the process?
Try:
curl http://localhost:8080/rest/dag/DAG/1.0/42/0/Input -H "Accept:application/json"
Since this process only has one input parameter, the result looks like:{ "{dag}DAG[1.0]": [ { "0": { "Input": { "time": "1000"}} } ] }A similar URL can be used to get the output of the process (simply replaceInputwithOutputat the end). -
What if I need to read the value of a single parameter of a running process?
Just append the parameter name to the URL, like this:
http://localhost:8080/rest/dag/DAG/1.0/42/0/Input/time
JOpera will return the value (without any JSON or XML around it). If the parameter contains HTML values, you can get the parameter address from a browser to show the HTML page you have generated from the process and stored in one of its parameters. -
What if I want to read the value of all input parameters of all tasks of a running process?
URLs can contain wildcards, like in the following example:
http://localhost:8080/rest/dag/DAG/1.0/42/*/Input
which will return the input parameters of all tasks of process instance 42. If you want to get all input parameters of all process instances, use the following instead:http://localhost:8080/rest/dag/DAG/1.0/*/0/Input
where the wildcard is used to match all instances and the following/0/Inputwill filter the process input parameters only. -
How do I delete a process instance from the command line?
You need to have the URL of the process instance and use the
DELETEmethod, like in the following:curl -X DELETE http://localhost:8080/rest/dag/DAG/1.0/42/
Note: You can only delete process instances that have finished (or failed).
-
Which standard media types are currently supported by the JOpera RESTful API?
JOpera supports
-
text/html -
application/json -
application/xml -
text/plain -
application/atom+xml(since version 2.4.9)
AcceptHTTP header. -
7.7: Other questions
-
How does JOpera relate to BPEL?
JOpera and its visual composition language are a bit more general than BPEL, which focuses on orchestration of Web services only. More in detail, there are several important differences:
- Even concerning Web services, most BPEL tools cannot call a service described by a pure WSDL 1.1 document, as this description needs to be augmented with additional metadata (i.e., the partner). In JOpera, you can import standard compliant WSDL documents and immediately invoke the Web service from a process without having to provide additional information
- Control flow: BPEL has several redundant constructs, given its origin which mixes a hierarchical (nested block) process modeling approach, with a flow (graph-based) process modeling approach. And even with this richness in the syntax, it has been shown that it lacks expressivity regarding several important workflow patterns. JOpera has a much simpler, graph-based model that is even more expressive!
- Data flow: BPEL uses a low-level (imperative) model based on assignements between variables, where each data transfer must be scheduled manually by the developer. JOpera uses a high-level declarative (or functional) approach, where it is enough to model a graph of data flow edges and the system takes care of copying the data at the right time
- Nesting: Although BPEL supports nesting with scopes inside a process, every interaction between different processes is done through a Web service interface. Thus, it becomes difficult for a BPEL engine to know whether a process is calling another process on the same engine or it is invoking a remote Web service. Thanks to its sub-process construct, JOpera processes can efficiently call (or spawn) other processes without having to pay the overhead of the Web services stack
- Syntax: BPEL is XML, and most visual BPEL editors sadly remind developers of this, as they provide an editing environment which is tightly coupled with the underlying XML syntax. JOpera keeps the XML under the hood and provides a true visual environment for Web service composition, where developers can concentrate on specifying the flow between tasks at a high level of abstraction without having to worry about the underlying XML syntax
- Library: BPEL standardizes as language elements several activities that should really belong in a library (e.g., timeouts). JOpera provides a rich and extensible library of reusable services, which cover important functionality (e.g., timeouts, XML data transformation, cancellation patterns) without affecting the language
- Snippets: BPEL lacks native support for embedding code snippets and BPELJ, a controversial extension to the standard, has been proposed to allow this. JOpera supports Java snippets natively and does not require any extension to the process modeling language in order to support other snippeting languages
7.8: Troubleshooting
-
Why has my process failed?
A process fails if at least one of its Tasks failed and there was no exception handler defined for it. An Activity fails if its Program returns with a non zero return code, or, in case of a Web service call, if a SOAP fault message is received. A Sub-Process fails if the process it called has failed.
-
After I save a process, its name doesn't appear in the Instance Navigator in the Monitor Perspective. Why?
Make sure that the
Project, Build Automaticallyis checked. Then modify the source OML file and re-save it. Otherwise try to do a clean build of the project withProject, Clean...Or maybe it is a good time to restart the entire workbench..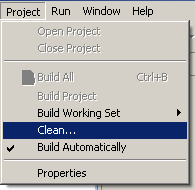
Figure 7.9: Make sure that the projects are built automatically -
How do I change the default port of the embedded application server?
The port is defined as a java system property. You need to start eclipse with the following command line:
./eclipse -vmargs -Dch.ethz.jopera.common.jetty.port=8081
Note: From Version 2.3.4 you can also use the
Engine Threadspreference page to configure the port and start and stop the embedded HTTP server. -
I need to use a proxy to access a Web service. How do I configure JOpera?
You need to configure the Eclipse JVM with the proxy address. There is a plugin on http://www.x-parrots.com/eclipse/ to help you with that. Otherwise you can start eclipse passing the following arguments:
./eclipse -vmargs -Dhttp.proxyHost=my.proxy.com -Dhttp.proxyPort=9999
. (Thanks to Jason Madoerin) -
How do I switch on
log4joutput?Look for the file:
eclipse/plugin/ch.ethz.jopera.common/config/log4j.properties
If it is not there, create it. You can also rename the sample file. To configure the level of detail of the traces, add the following line into the file:log4j.logger.ch.ethz.jopera=DEBUG
wherech.ethz.joperais the package for which you want to switch debugging output on. More information on how to configure log4j can be found in thereadme.txtfile.

